Data Manipulation Using Python

““I can’t tell you how many shows I’ve done with full-blown migraine headaches.”
”
Barometric Pressure Changes: Click for Python Code
THE FOLLOWING PROJECT COMPARES BAROMETRIC CHANGES ACROSS SEVERAL CITIES IN THE US: THE PYTHON PROGRAM USED FOR HE ANALYSIS IS ALSO GIVEN
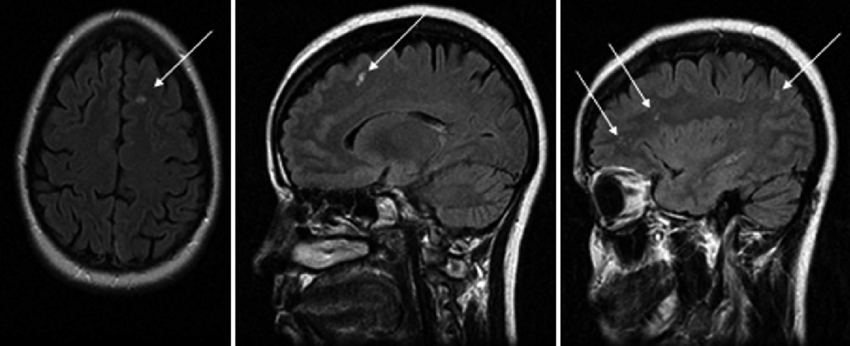
Migraines are debilitating. In fact, some people may experience migraines of such intensity that they may need the attention of a doctor or go to the hospital. Or worse, call an ambulance. Many suffer from nausea, vomiting, increased sensitivity to light and sound, numbness and severe pain.
Migraines have been linked to weather changes, more specifically to changes in atmospheric pressure. While not everyone is sensitive to atmospheric pressure changes, those who are would benefit from knowing when such changes may occur. Also, the volatility in atmospheric pressure is different by geographic location. As a result, some people may decide to move from areas where the pressure is volatile to a location that is more “calm”.
The National Oceanic and Atmospheric Administration (United States Department of Commerce) is a scientific agency that is tasked to focus on conditions of oceans, waterways and the atmosphere. Among the plethora of data collected by NOAA is weather related information, which includes station and sea level atmospheric pressure readings. Such data is collected by thousands of weather stations hourly and the readings are collected by NOAA. Some weather stations have been providing weather data since the mid-1940’s.
I selected several cities to see if there really is a difference in volatility of barometric pressure by geography. Additionally, I selected relatively large metropolitan areas and specifically chose weather stations located at major international airports. The cities examined are shown on the map below.

Bangor, ME . Dallas, TX . Denver, CO . Honolulu, HI . Lincoln, NE . Little Rock, AR . Miami, FL . Newark, NJ . New Orleans, LA . Phoenix, AZ . Raleigh, NC . San Diego, CA . San Francisco, CA
I restricted the analysis to a more recent time period given the hourly readings available to the 1940’s. Therefore, the analysis focused on data between January 1, 2015 and September 1, 2019.
Many of us are constantly looking data to analyze. If anyone is interested in weather data, it can be downloaded from NNDC Climate Data Online (https://www7.ncdc.noaa.gov/CDO/cdopoemain.cmd?datasetabbv=DS3505), which is provided by NOAA.
I calculated the standard deviation of hourly barometric pressure changes. Standard deviation is a statistical term and it is designed to measure how individual observations vary about the average. A large standard deviation means more variability and a lower standard deviation means less variability. In this case, the measurements were reported in millibars.
Here is the data for all 15 cities. Note that the average hourly measurements are also different by city. Denver is the lowest at 1013.7 millibars. Given its status of the Mile High City, this should not be surprising.
| Cities | Standard Deviation | Mean |
|---|---|---|
| Honolulu | 2.66 | 1015.80 |
| San Diego | 3.52 | 1015.65 |
| Miami | 3.60 | 1017.40 |
| San Francisco | 4.77 | 1016.29 |
| New Orleans | 5.02 | 1017.50 |
| Phoenix | 5.12 | 1011.36 |
| Little Rock | 6.41 | 1017.61 |
| Dallas | 6.61 | 1015.77 |
| Raleigh | 6.64 | 1018.25 |
| Las Vegas | 6.79 | 1014.46 |
| Seattle | 7.04 | 1017.85 |
| Chicago | 7.62 | 1016.84 |
| Denver | 7.63 | 1013.72 |
| Newark | 7.88 | 1017.14 |
| Lincoln | 8.36 | 1016.70 |
| Bangor | 9.10 | 1015.61 |
There appears to be considerable difference in the standard deviation of atmospheric pressure by city. Honolulu, HI had the lowest standard deviation (sd: 2.66) suggesting very little variability. San Diego, CA (sd: 3.52), and Miami, FL (sd: 3.60) also had very little variability. In contrast, Bangor, ME (sd: 9.1) had a considerable variability in barometric pressure. Lincoln, NE (sd: 8.36) was a close second on the list, also with significant variability in hourly barometric pressure measurements.
Next, I recoded the all hourly measurements based on the date stamp to see which season the measurement was taken. The following schedule was used to determine the season in which the measurement was taken.
| Season | Starts | Ends |
|---|---|---|
| Spring | March 20 | June 21 |
| Summer | June 21 | September 23 |
| Fall | September 23 | December 21 |
| Winter | December 21 | March 19 |
I wanted to see how varied barometric pressure measurements were by season. Once again, I calculated the standard deviation of hourly measurement values by season, and found significant differences. Measurements varied most around the average in the winter, (sd:8.05) and least in the summer (sd: 4.31), therefore measurements were twice as volatile in the winter than in the summer.
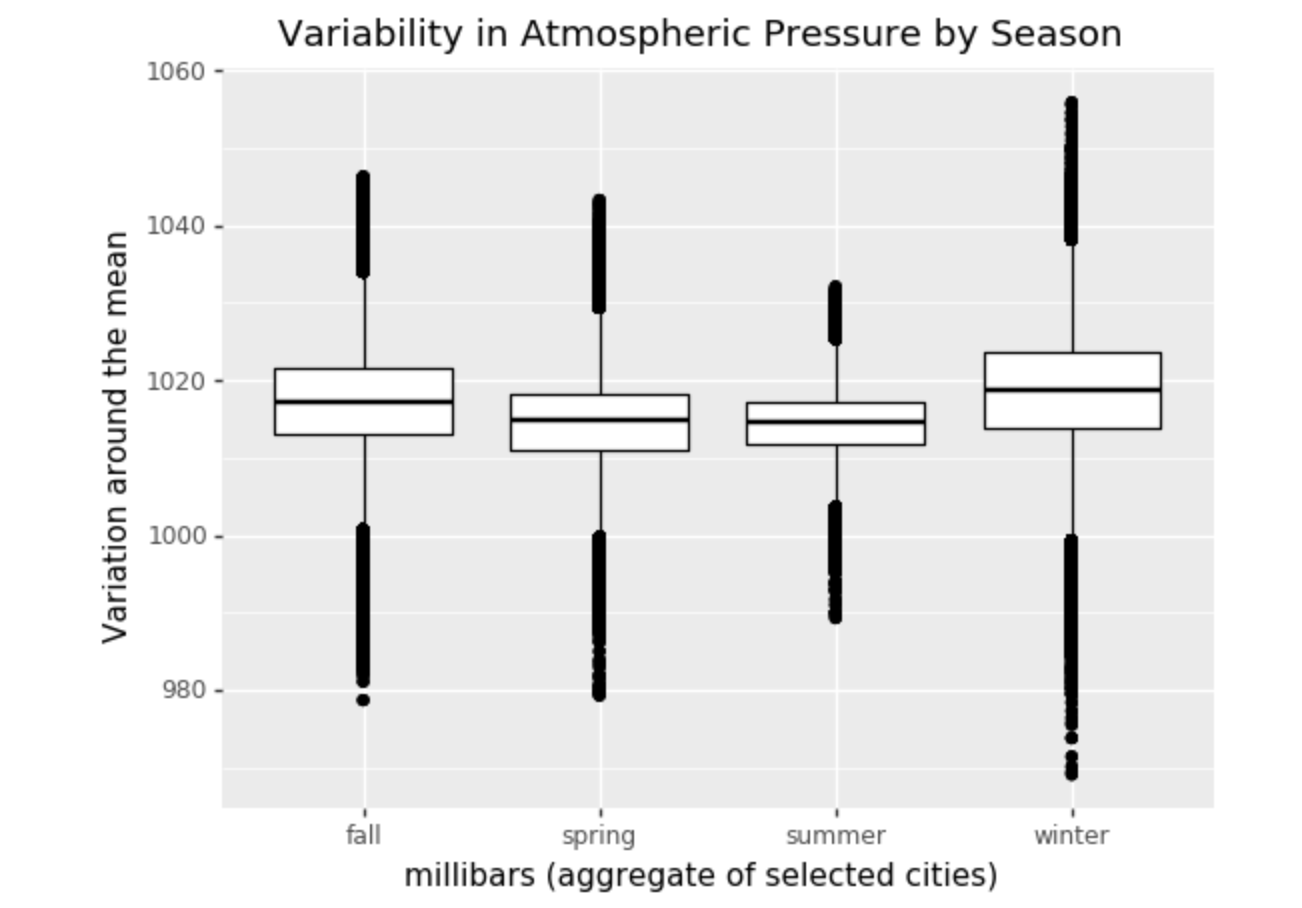
The same variability trend can be observed by city, meaning winter is always the most volatile and summer is always the least volatile. Interestingly, a Japanese study in the journal Internal Medicine (Influence of Barometric Pressure in Patients with Migraine Headache) found that the incidence of migraine headaches increased when the atmospheric pressure dropped more than 5 hectopascals in two consecutive days. (Five hectopascals is five millibars.)
https://www.jstage.jst.go.jp/article/internalmedicine/50/18/50_18_1923/_pdf
The likelihood of such a drop therefore is more likely in the winter than in the summer, given that the variability in measurements was greater in the winter than in the summer.
CONCLUSION:
Given that the variability in atmospheric pressure may cause more frequent migraines, a climate with less variation may be preferred. Cities such as Honolulu, San Diego and Miami seem to have a more ideal climate if one only cares about variability in barometric pressure. I have heard of discussions about people moving to locales with more preferred climates because of migraines.